Twelve weekly spreadsheets, three weeks late
Every general manager built their own weekly return and emailed it on Tuesday. By the time head office could compare twelve sites, the week was three weeks old.
- Client
- A twelve-site hospitality group
- Sector
- Hospitality
- Duration
- 12 weeks
- Year
- 2026
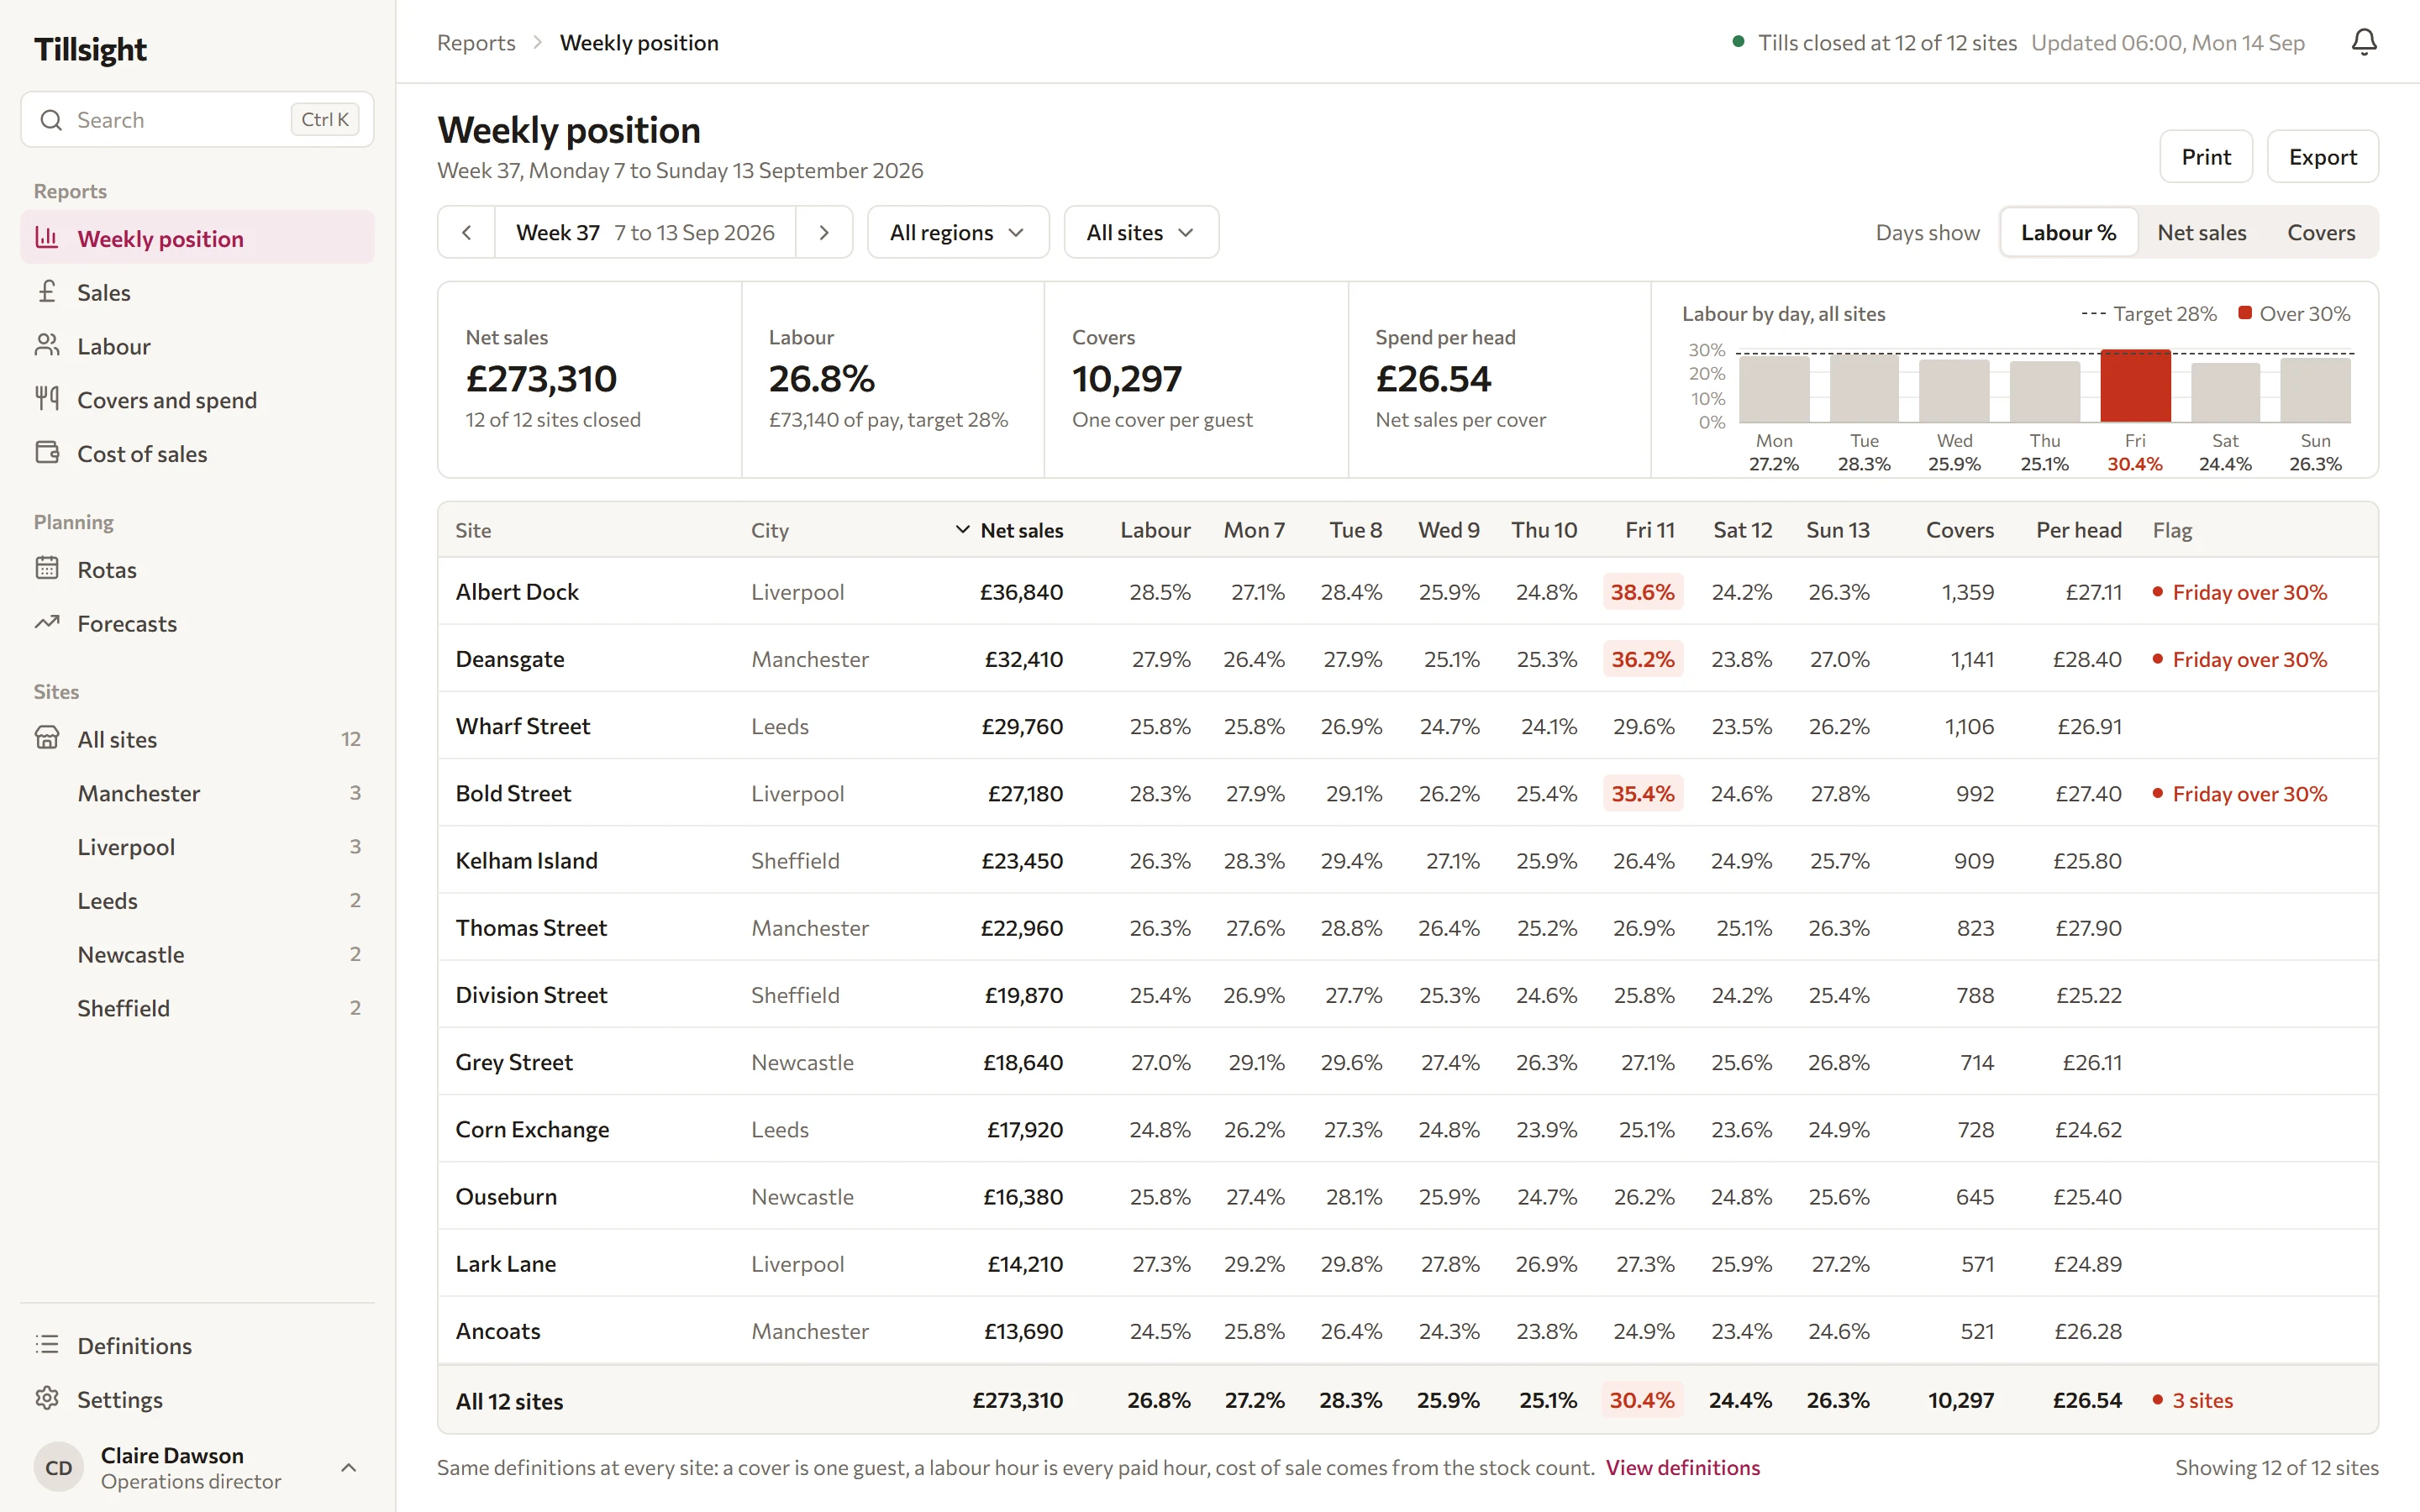
Weekly numbers ready
- Before
- ~3 weeks later
- Now
- 06:00 Monday
Time consolidating
- Before
- ~2 days / week
- Now
- None
Sites comparable
- Before
- 0 of 12
- Now
- 12 of 12
Labour overrun caught
- Before
- After the week
- Now
- Before it is published
The problem
The group ran twelve sites and about 240 staff on roughly £14m of turnover. Every general manager produced a weekly return in a spreadsheet they had built themselves, and emailed it on Tuesday.
Head office consolidated the twelve by hand, which took most of two days. A bad week surfaced about three weeks after it happened, by which point the same week had been run three more times.
Takings came from the tills, cost of sales from the stock count, and labour from the rota. All three existed in systems the group already paid for.
What we found
The twelve spreadsheets did not agree on what they were measuring. Four counted a cover as a booking, the rest counted it as a person. Two put salaried managers in the labour line and ten did not.
Consolidating them produced a group total and nothing a single site could be judged against. The operations director had been making site by site decisions on figures that meant different things at each site.
Once a year of history was put on the same definitions, the labour overruns clustered hard on Fridays, and almost entirely at the four largest sites.
How we got there
Twelve weeks. The tills, the stock count and the rota already held every number. What the group lacked was agreement on what the numbers meant, and people had to settle that before anything could be built.
Agreeing what a cover is
Twelve general managers each had a spreadsheet they had built and would defend. The definitions were settled with all of them in the room, one line at a time: a cover is a person, and salaried managers count as labour. Every site's past year was then restated on the new definitions, so no site looked worse overnight without an explanation.
A year of Fridays
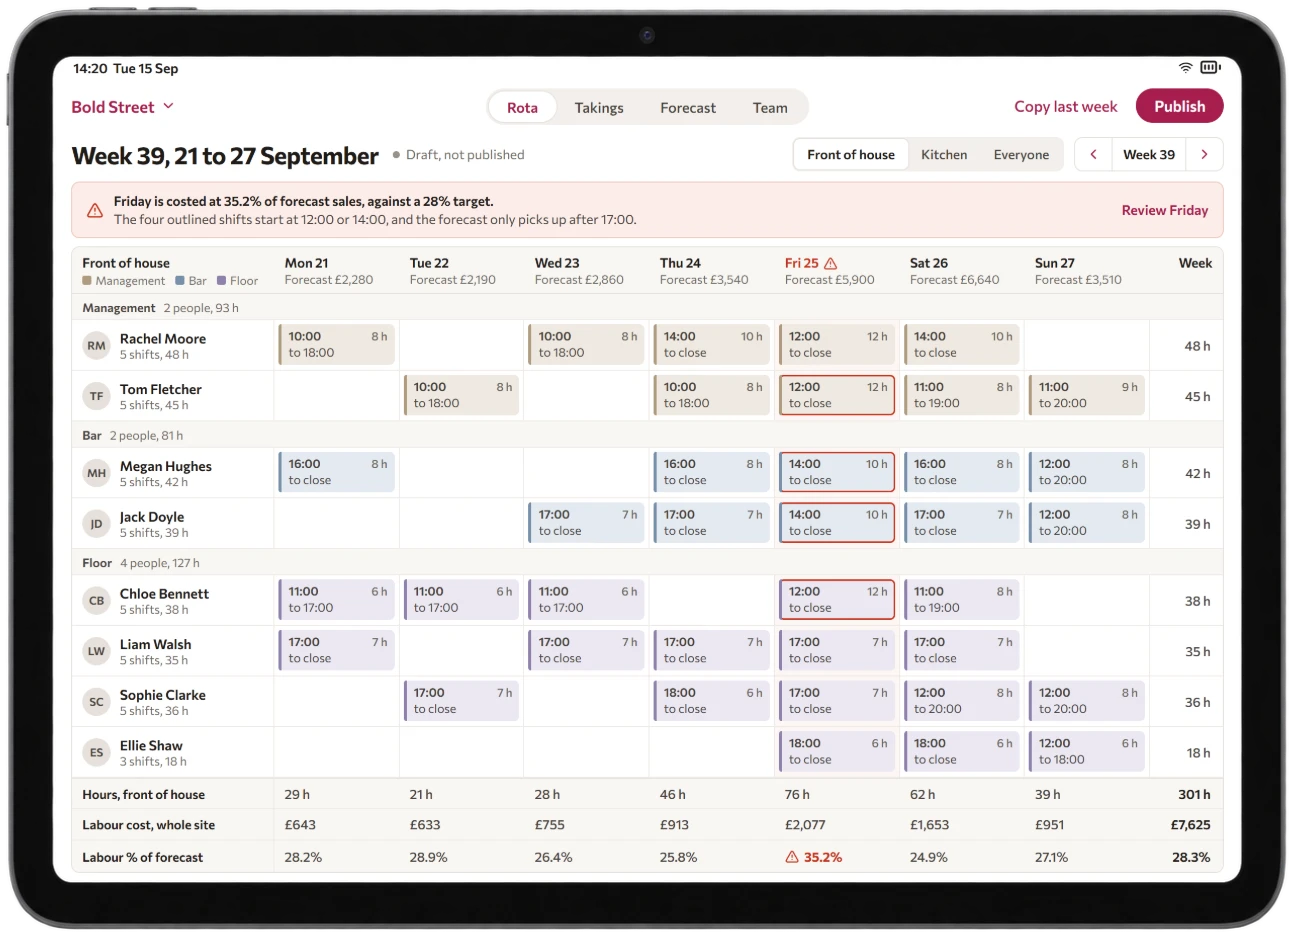
With a year on one set of definitions, we drew labour against sales for each day of the week. Friday stood out at the largest sites, and the cause was on the rota. Shifts were starting early in the afternoon for an evening that did not get busy until seven.
A forecast managers could argue with
A rota can only be priced against a forecast, and a general manager will not trust one they cannot see into. Ours is deliberately simple: the same day in recent weeks, which the manager can adjust for what the system cannot know. We checked it by pricing past paper rotas on the screen to see whether it would have caught the Fridays that overran.
The night ends after midnight
The first version closed each day at twelve, which put the last hours of a Saturday night into Sunday. Every site now has its own end of day, set to when it actually shuts, and the week closes once the last site's tills have been read.
What we built
The rota costed before it is worked
Shifts are priced against the sales forecast for that day, so a Friday that will overrun is visible on Tuesday when it can still be changed.
One definition, twelve sites
A cover, a labour hour and a cost of sale mean the same thing everywhere. Comparing one site against another only became possible after that.
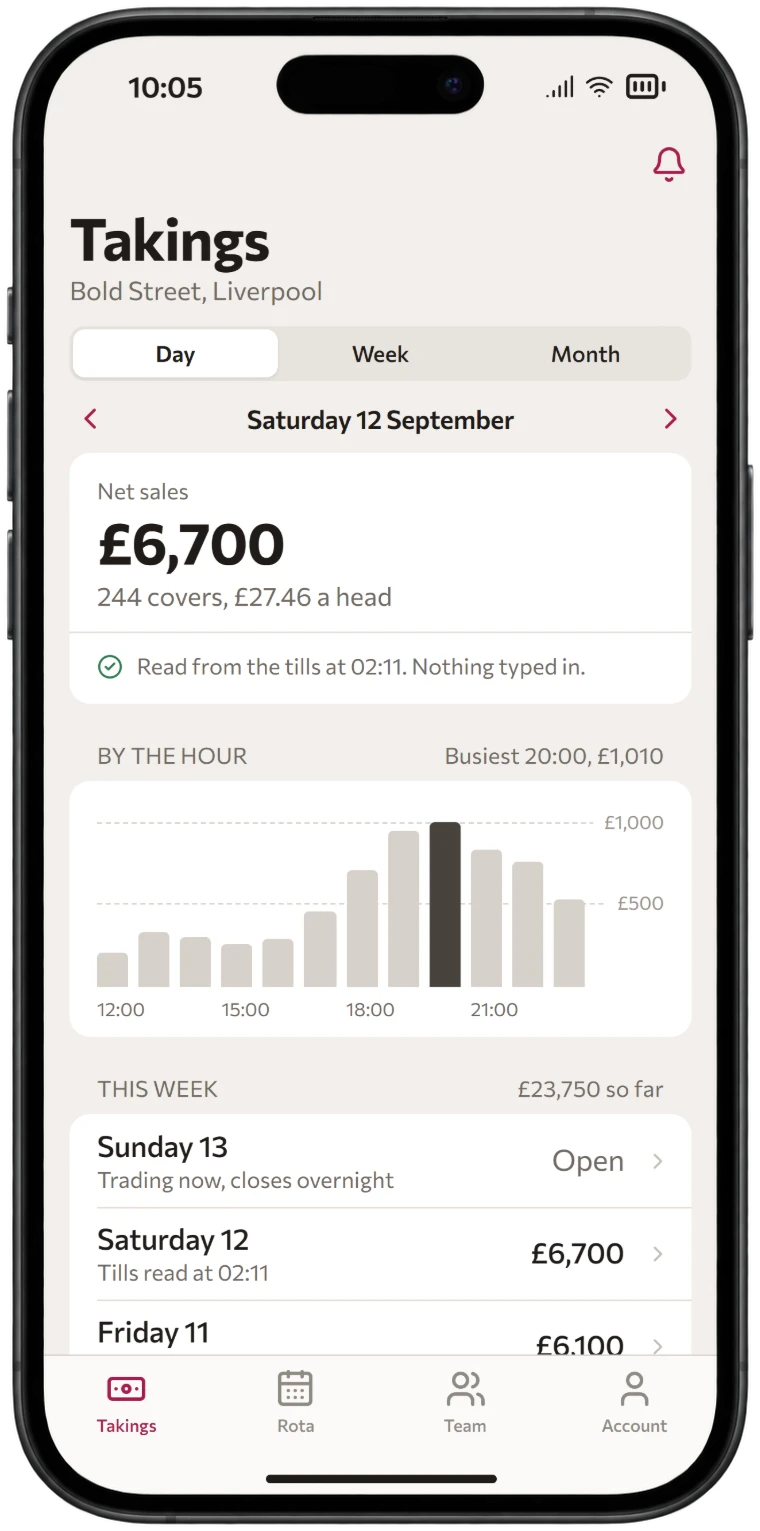
Takings straight from the EPOS
Sales read from the EPOS at each site overnight, so the week closes itself. No general manager types a figure in.
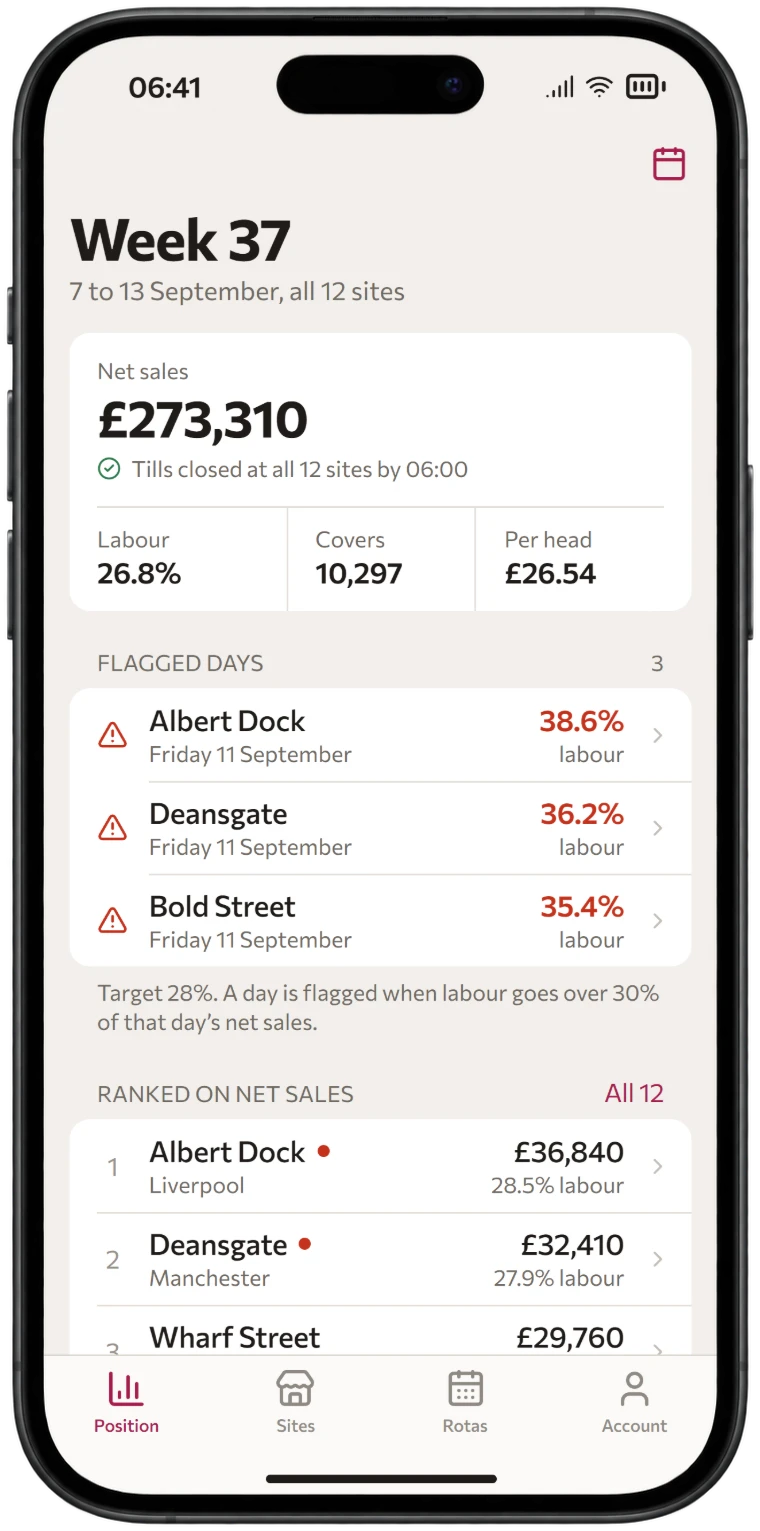
The Monday position
Twelve sites ranked on one screen at six on Monday morning, with the flags attached to the day they happened on.
Afterwards
The group did not use this to cut hours. They moved them, mostly off Friday afternoons and onto Sunday, which had been understaffed at four sites for a year without anyone being able to prove it.
The two days a week that went into consolidating did not come back as savings either. That person now spends them on supplier pricing, which the finance director considers the better trade.
Built with
- TypeScript
- React
- Next.js
- PostgreSQL
- Prisma
- Scheduled overnight jobs
- Lightspeed EPOS API
- Xero Accounting API
- Tailwind CSS
- Hetzner
Services used
More case studies


Is this your problem too?
If any of the above sounded familiar, describe your version of it. The first conversation is about whether software is the right answer at all.
From £10,000Most projects land between £15,000 and £55,000.